the bigger picture:
(the last, very right bar of the upcoming charts is still in motion for two more month and can drastically change the picture but let us zoom out here to get a feel what the large players are looking at)
a look at gold over the last 50 years reveals some significant POIs
what I consider a stunning synchronicity is that the POI of the time probability event curve (green marked time cycle curve resting above the indicators on the bottom of the price chart) has its next significant event in October 2024, right in alignment with election day being November 5th that year
in alignment with a bullish uptrend and a high probability breakout pattern in the making this time cycle node could provide for a profit taking target in gold for the numerous spot trades we have initiate and the financing spot for the physical holdings to mitigate risk:

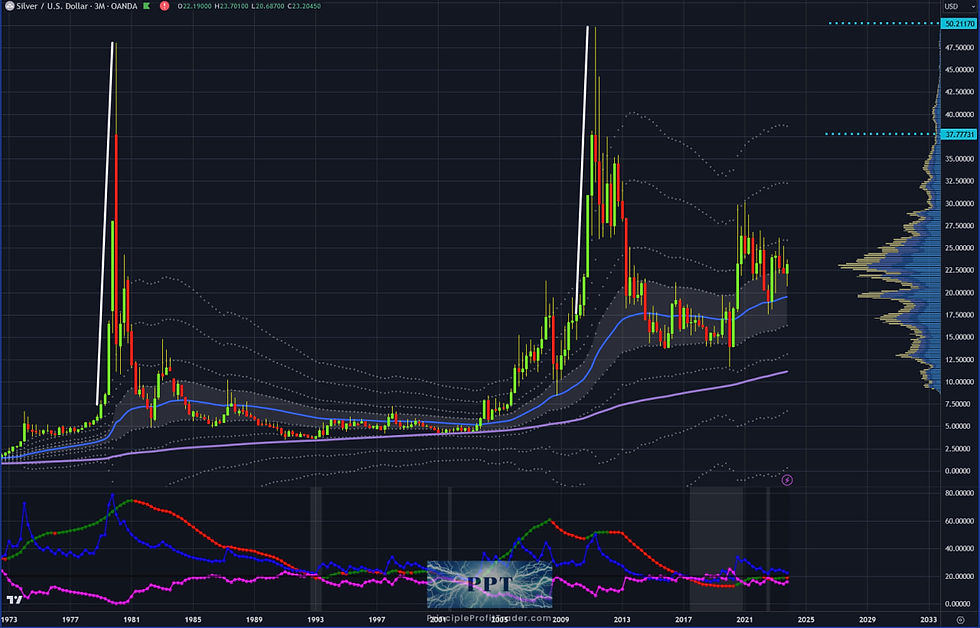
a look at the quarterly chart of silver reveals a few personal traits of this trading instrument as well
the two vertical white lines illustrate that silver can in just four quarters move multiple X of price
in 1997 silver moved from 5.96 to 48 dollar, that's the equivalent of a 705% return
in 2010 silver prices jolted from 14.65 to 48.91 dollar
a profit return of 234%
in addition we can make out that silver only briefly stays at these elevated levels and that would lead us to a similar conclusion should gold find its advancement within the next two quarters that silver might have one of its stellar moves and substantial profit-taking could be timed close to election time next year in November
while this is just one of many scenarios we find it essential to have a narrative like this under our belt with substantial physical acquisitions in the $ 12 and $ 14 region which we posted in real time
rehearsing early when no emotions are involved clear plans for profit taking is even more important than low risk entry prep since it is in exits where the real money lies:

as a continuation of painting probability pictures for possible target exits, we now are looking at a quarterly chart of bitcoin since its inception and can tell that this trading instrument is producing phenomenal returns
using a trend based Fibonacci extension as a time tool for predicting low entry points has proven so far to catch these legs efficiently and a projection using such a tool points for a upcoming profit target region near $163000:

for projections of the S&P we thought there to be a larger sample size providing for a better estimate
the first chart represents a trend measuring view providing on how congruent in time segments the S&P was expanding harmonically starting from the 1950ties until the end of the 1980ties
it did so with quite substantial percentage move jolts and we used an unusual approach of using a CCI oscillator typically used for sideways markets where we took the turbo (yellow line) as an oversold momentum tool to measure entry starting points for this example:

the second chart is the second data series from the late 1980ties to the mid 2020ties
what we can see is that while the S&P are in a constant uptrend there are phases like the one from 1994 to 2014 where prices go sideways
we can also make out that once a starting point is set (a deeper than usual momentum move), it is rare that these lows will revisit
the way price finds itself recently we would most likely build a wider double top and while ones holdings from lower than3500 could be protected from an investment perspective it isn't lucrative to have ones exposure there since a longer sideways period is to be expected
this would be in lineup with our previous metal hypothesis
and again is just one scenario to be rehearsed amongst many others

the most important take away from my presentation of the larger time frames is to be aware of the dominant forces from a top down perspective of higher to lower time frames
and an anticipatory rehearsal of when and where to take profits since these things are not be decided when extreme prices representing extreme emotions catch up with a traders inability to see markets clearly and execute in the most conducive way for consistent profits
Comments