A New Year
- Korbinian Koller
- Jan 6, 2024
- 2 min read


gold shows here near the major resistance zone various weekly formations to be considered:
possible "V" continuation:

quintuple top price rejection:

confirmed directional change with dark cloud cover formation after dragonfly doji:

bullish price channel formation:

beauty principle pattern:
red followed by three green bars up

in summary:
if you look at the weekly gold bar you find most dominantly bears to have controlled this last week and forming a dark cloud cover price formation
yet major support zones from an upward channel perspective have not been broken yet and we are in the first week of the year where major portfolio allocations are placed
=a zone of abnormalities not averages
this weeks weekly bar itself also shows some weakness from a bears dominance perspective with its wick to the downside rather portraying a uncertainty doji versus a clear massive defeat of the bulls
that being said we see the battle not just quite over yet and as such do not place substantial bets to the downside just yet to avoid high risk entries

silver, finds itself weaker than Gold already in its second leg down
its beta accentuates moves and as such has given up more profits this week
prices closed right near a massive VPOC
prices are still supported from the 200SMA and are nearing the APEX of a large triangle formation promising that once direction is firmly established a massive directional move can be expected
like gold the weekly bar of this week also shows quite a tail to the downside with bear presence still alive:


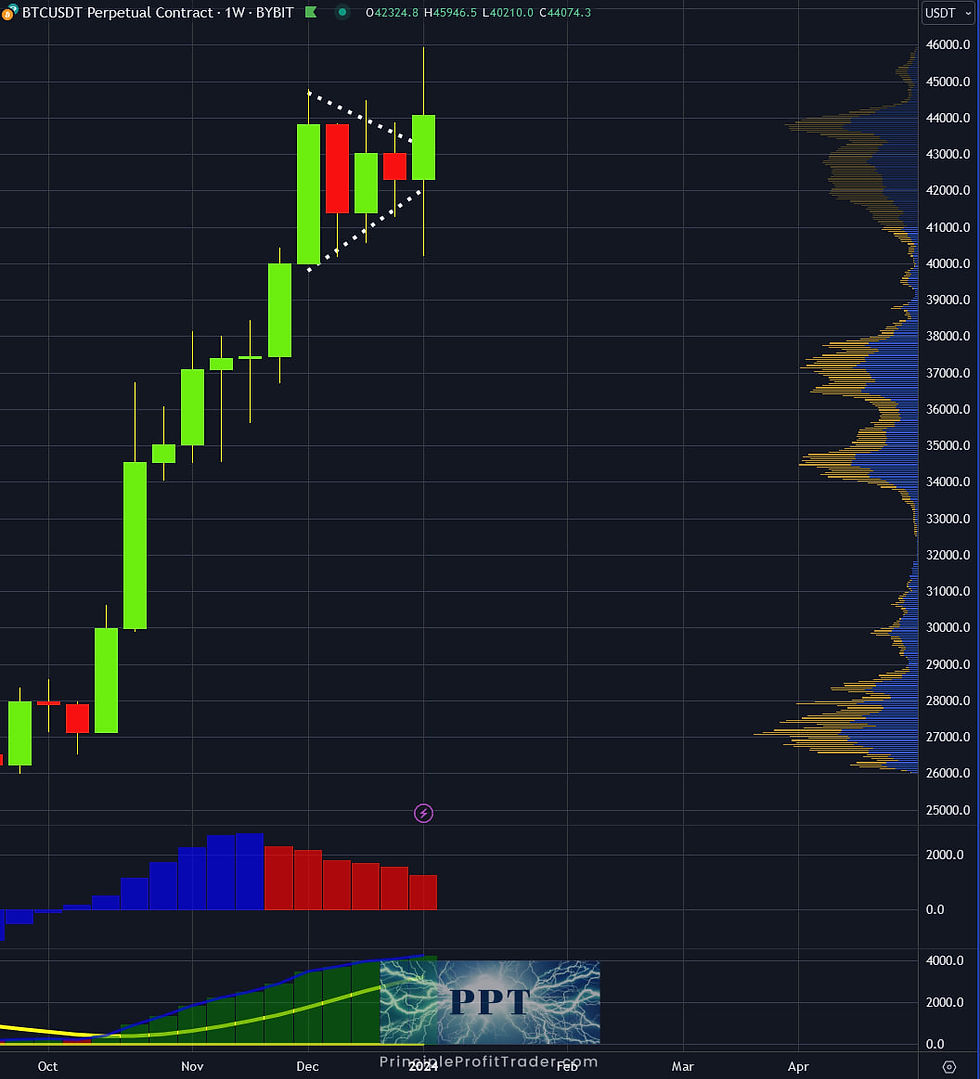
you might remember this analysis from quite a while ago and anticipated price moves at the time did manifest
this weeks price performance ended on a bullish note
the overall green bar shows breakouts on both sides
ending in a PAT situation
presented by two dominant wicks


ES trading of this week wiped out more than 2 weeks prior profits confirming a wide double top after an extended multi week bullish up move
again all price behavior needs to be seen under the fact of trading from a time perspective at extremes it being the roll over into the new year where abnormal order flow of larger player portfolio allocations can throw a wrench into smaller time frame charts

Comments